Operations#
To answer many operational queries that aren’t covered by the default Salt Grafana dashboards, you can use ad hoc queries.
Making ad hoc queries in Grafana Loki#
To make a query, click Explore in Grafana, choose a Loki data source and then specify a LogQL statement.
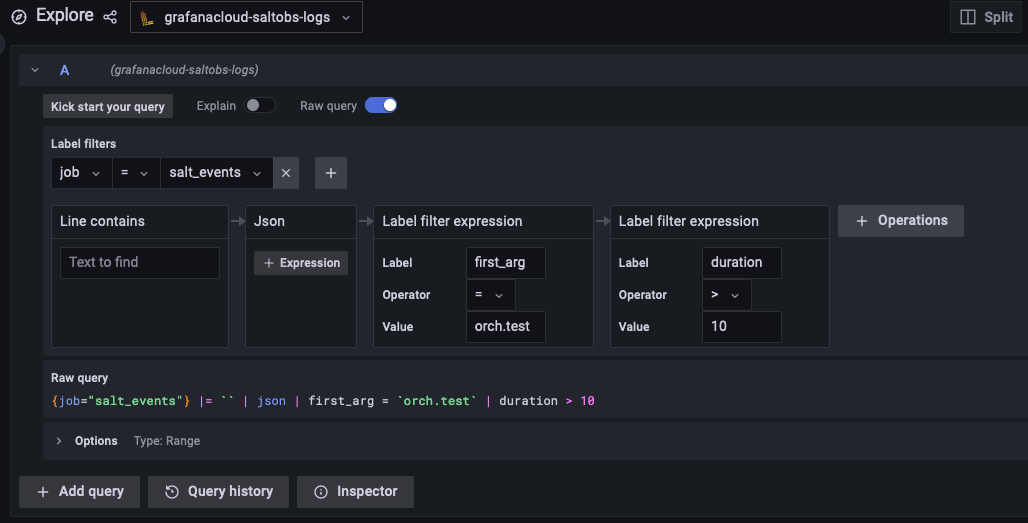
{job="salt_events"} |= `` | json | first_arg = `orch.test` | duration > 10
Making ad hoc queries in PostgreSQL#
The main table is salt_returns, but most of the queries will be easier with the states view. To make a query, click Explore in Grafana, choose a PostgreSQL data source and then specify an SQL statement. Below are some useful patterns that you can combine together.
Time window
To make queries faster, it is always recommended to specify a time window. This can be done either using the jid column:
SELECT * FROM states WHERE jid >= '20221124000000000000';
Alternatively, you can use the derived jid_timestamp column:
SELECT * FROM states WHERE jid_timestamp >= '2022-11-24';
SELECT * FROM states WHERE jid_timestamp BETWEEN '2022-11-24' AND '2022-11-25';
Jobs launched by user
SELECT * FROM states WHERE username = 'user';
Specific state function
This can answer a question like “which job changed this file” or “which job stopped the service”.
SELECT * FROM states WHERE state like 'pkg_|%|-installed' and return->>'name' = 'vim';
Specific sls file
SELECT * FROM states WHERE return->>'__sls__' = 'orch.test';
Last job
SELECT * FROM states ORDER BY jid DESC LIMIT 1;
Jobs that target specific minion
SELECT * FROM states WHERE id = 'minion1';
By job status
SELECT * FROM states WHERE result IS true;
Jobs that changed something
SELECT * FROM states WHERE changes IS true;
Other useful commands#
Find all files managed by Salt on a minion:
salt minion1 state.show_lowstate --out json | \
  jq -r '.[][] | select(.state == "file") | "\(.name): \(.__sls__)"'
Find which state manages a file:
salt minion1 state.show_lowstate --out json | \
  jq '.[][] | select(.state == "file" and .name == "/etc/mailname") | .__sls__'